Dan Lichtenberger · New York
Six systems, and what each one actually proved.
I build things that make a measurable claim — and then I try to break the claim.
Three of the projects below failed to beat their baseline, and they say so,
with the confidence intervals that show it.
Built May to October 2026 and ordered strongest first. Every project is deployed to a public URL, and every
screen below is a recording of the real deployment, not a mockup.
6 / 6
projects deployed to a public URL — not just a repository
1,337
automated tests running in CI across five of the codebases
24 weeks
from the first commit of the oldest project to the most recent
3
report null or negative results — the finding is that it didn't work
Research studyReinforcement learningLive dashboard + LaTeX paper
How Reinforcement Learning Agents Fool You
PPO implemented from scratch, then pointed at a deliberately brutal testbed — financial
markets — to ask one question: does an agent that looks brilliant in a single run survive
being run five times?
TakeawayA +275% single run was luck: across 10 seeds the edge over buy-and-hold is not significant (p = 0.79).
Screen recording · the live labThe Agent Playground, running in the browser. A trained policy steps through real
BTC-USD bars while equity, target exposure, per-bar reward and drawdown stream in together
— with transaction cost and slippage as live inputs. Every run ends with a reproducibility
receipt naming the experiment, the data source and the settings.
The run I nearly published
+275% vs. +19% · superseded v1, commit d4c0ef9
Rebuilt, 10 seeds
+57% vs. +34% buy-and-hold · p = 0.79
Domain randomization, held-out
−25% → +31% stocks, 10 seeds
Every seed, plotted against the benchmark it has to beat
Each dot is one training seed's return minus buy-and-hold over the same window, so
the zero line means “tied with simply holding the asset.” The bracket is the 95%
confidence interval of the mean.
The crypto cloud straddles zero — its interval includes “no edge at all,”
which is what p = 0.79 means. Every stock seed lands far left of it: that arm is
not inconclusive, it is reliably worse than holding the index. A single dot from the right-hand
tail, reported alone, would have looked like a discovery.
Table view
Market
Worst seed
Best seed
Mean excess
95% CI
p
Crypto
-62%
+192%
+23%
[-17%, +73%]
0.79
Stocks
-276%
-235%
-259%
[-266%, -251%]
0.002
This is the project I'd point at first, and it is first for that reason. It is designed to
produce a negative result honestly, and it does. The framework implements Proximal Policy
Optimization with Generalized Advantage Estimation from first principles in PyTorch —
gradient clipping, entropy bonus, orthogonal initialization, running observation normalization
via Welford's method — over two custom Gymnasium environments sharing identical accounting
and cost mechanics.
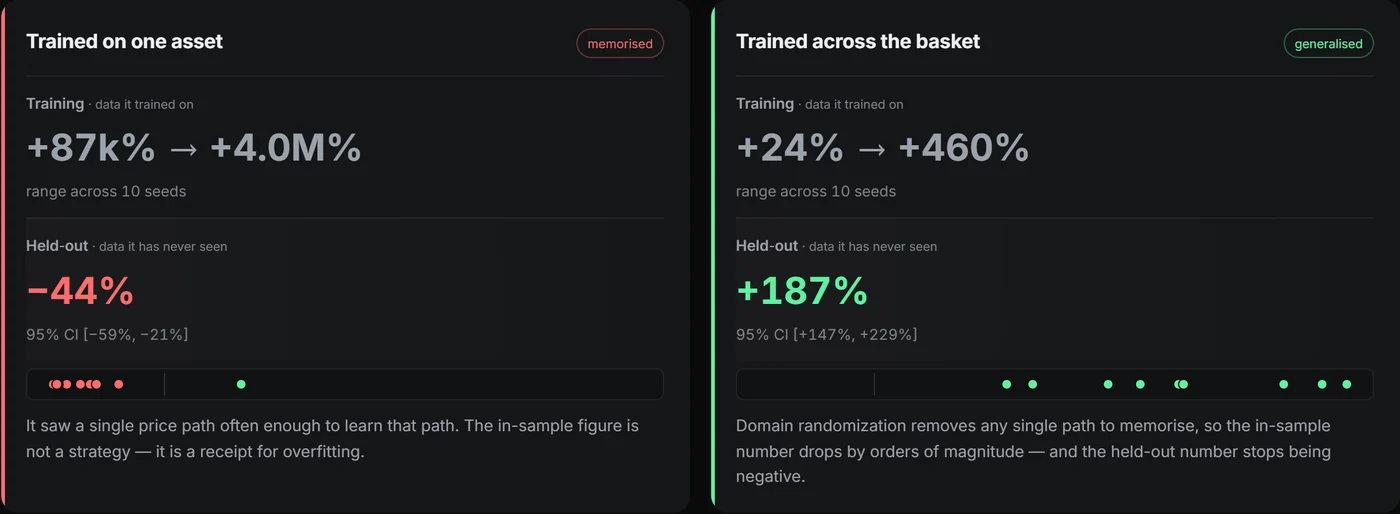
Screenshot · the findingThe whole argument in one figure. Both arms were trained identically and scored on the
same held-out paths; the only difference is how many assets they saw. The overfit arm's
in-sample return of +4.0M% becomes −44% the moment it meets
data it has never seen. Each dot is one seed.
Scroll it sideways to read the detail.
Reported finding
No seed-robust edge over buy-and-hold. One favorable run returned +275% against a
+19% benchmark, and that was the version I nearly wrote up as the finding — it is
superseded, and the project site cites the commit
(d4c0ef9, test window ending 2026‑06‑17) rather than quoting it as current.
Rebuilt and rerun under ten seeds, individual returns ranged from −29% to +226%; the mean,
+57% [+16%, +106%], cannot be distinguished from buy-and-hold's +34% (p = 0.79). The stock agent
returned −19% [−27%, −11%] against buy-and-hold's +240% — significantly
worse, at p = 0.002. Retrained across four separate slices of Bitcoin's history, it lost
money in every one. A replication on ten fresh seeds, with its predictions committed before the
run, held on all four counts (stock p = 0.002; crypto p = 0.88); the one figure that did not
survive was the crypto mean's interval, which now includes zero.
Separately, an agent trained on a single price path memorizes it catastrophically; training on a
freshly generated synthetic path each episode flips held-out return from −25% to +31% on
equities and from −44% to +187% on crypto — across ten seeds, with all four confidence
intervals excluding zero. Reported as a distribution rather than a single run, because the
in-sample figure that version quoted swings by an order of magnitude between seeds.
The result reproduces Henderson et al. (2018) on the unreliability of
single-run RL evaluation, in a domain where the incentive to publish the lucky seed is strongest.
Method
Observation space. 28 engineered features spanning momentum horizons, trend indicators, oscillators, volatility-regime signals, volume microstructure and cross-asset context. Continuous action targeting a position fraction (long / short / flat).
Leakage control. Chronological train/validation/test splits with feature scalers fit on training data only.
Statistics. Bootstrap confidence intervals across seeds, paired permutation tests against buy-and-hold, rolling multi-fold walk-forward evaluation. Results are reported as distributions, never single runs.
Replication. The harder cross-sectional problem — allocating portfolio weights rather than timing one asset — reaches identical conclusions.
Deployment. The trained policy is exported to NumPy archives so the inference API runs with no PyTorch dependency.
Finds the encryption inside a codebase that quantum computers are expected to break,
scores how exposed the project is from 0–100, and names the specific NIST-standard
replacement for every finding.
TakeawayUsage-aware scanning reaches 100% precision on its own benchmark (naive matching: 49.1%) and 93% on a random, hand-labeled sample of real-world findings.
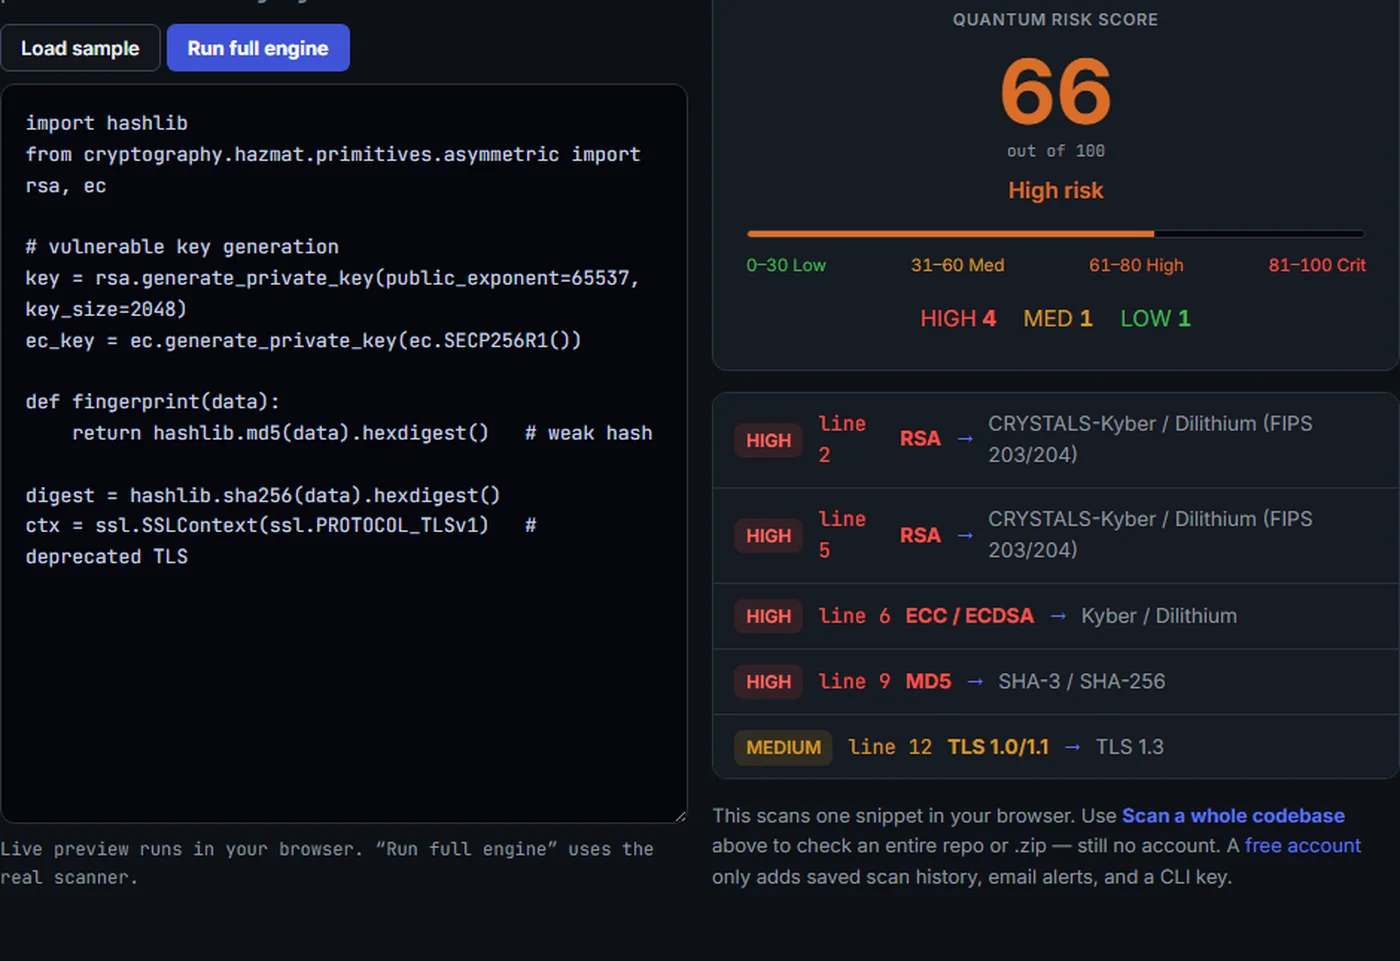
Screenshot · a real scanA live scan, no account needed. Paste a snippet and the engine scores it, flags each
at-risk primitive with its line number, and names the FIPS 203/204 replacement. The same
engine runs against a whole repository or an uploaded .zip.
Scroll it sideways to read the detail.
Precision on labeled benchmark
100% vs. 49.1% naive baseline
Languages parsed
11
Real-world audit
5,609 findings, 11,275 files
The interesting problem isn't matching the string RSA — it's not matching it
inside a comment, a docstring, or a code path nothing ever calls. A hybrid AST-and-regex engine
with usage awareness and reachability ranking eliminated 27 false positives the naive
pattern-matching baseline produced, taking precision from 49.1% to 100% on an 18-file,
9-language benchmark, with 100% recall on 50 seeded cases under mutation testing. Because that
benchmark is the one it was tuned on, precision was also measured on 100 findings drawn at random
from real PyPI packages and labeled by hand: 93% (95% CI 86–97%). Four of the seven misses
were one rule flagging the flags that turn old TLS off; that rule is now fixed.
Method
Attack. Shor's and Grover's algorithms implemented on the Qiskit simulator, so the HIGH risk rating on RSA, ECC and Diffie-Hellman is demonstrated rather than asserted.
Detect in code. Cross-language AST + regex scanning with dependency analysis; results export to JSON, HTML, SARIF, CycloneDX CBOM and SVG badges so it drops into an existing CI pipeline.
Detect on the wire. A website's quantum exposure is in its TLS handshake, not its source. TLS 1.3 removed the key exchange from the cipher-suite name and Python's ssl cannot read the group, so the scanner builds a ClientHello by hand: it offers post-quantum hybrids but a key share for X25519 only, so a server preferring a hybrid has to name it in a HelloRetryRequest. It also reads every signature in the certificate chain — Cloudflare's leaf is modern ECDSA, but an intermediate above it is signed with RSA, which a leaf-only check misses.
Prioritise. A severity score says how much vulnerable cryptography exists, not whether you will finish migrating in time. Mosca's inequality — secrecy lifetime plus migration time, against time-to-quantum — turns it into a deadline. No default is supplied for the quantum date, because nobody knows it; the tool reports the break-even year instead, which needs no such guess.
Fix. A lattice-based (LWE) key-encapsulation mechanism written from scratch — the underlying math of CRYSTALS-Kyber / ML-KEM — rather than a library call.
Field results. Paramiko, the standard Python SSH library, scores 100/100 Critical with 110 findings. Across 37 PyPI packages, 32 (86%) contained at least one finding. In a study of 8 widely-used projects, 88% contained HIGH-risk usage, mean score 61.4/100.
Assurance. 559 automated tests in continuous integration, plus a baseline mode that fails a build only on new findings — so a project with an existing backlog can ratchet it down instead of disabling the check.
Live systemStatistical validationProbabilistic forecastingalphaglyph.org
AlphaGlyph
A backtesting and forecasting laboratory built on the assumption that its own results are wrong
until they survive the statistical tests institutional quant funds use to separate skill from luck
— including the forecast it makes about tomorrow.
TakeawayThe best backtest in a 42-variant search is more likely overfit than not (72%), and the forecaster scores a coin flip (AUC ≈ 0.51).
Screen recording · a real backtest“Watch it trade” — the backtest replayed day by day. The equity curve grows
against the SPY benchmark while each trade streams in with a plain-English reason
(“bought because the stock was trading near its 52-week low”) and its realised P&L.
Nothing about the run is hidden behind a single summary number.
Forecaster test AUC
≈0.51 a coin flip
In-sample Sharpe surviving OOS
~52% median
Tests in CI
192
Probability that the best backtest in the search is fooling you
Combinatorially-symmetric cross-validation over a 42-variant trend and mean-reversion grid on
SPY. Above the 50% mark, the in-sample winner is more likely than not to land in the bottom
half out-of-sample.
0%50% · coin flip100%
72% on the run of 2026-08-01. An earlier run of the identical procedure returned
63% — same code, same grid, same ticker, a different window. The drift is the point:
a single PBO quoted as a constant is the exact error the metric exists to catch.
Anyone can produce a backtest with a good-looking equity curve. This one runs day-by-day
simulations with walk-forward cross-validation, rolling Kelly position sizing with no look-ahead,
transaction costs, regime tagging and an SPY benchmark — then subjects the output to
Probabilistic and Deflated Sharpe ratios, Fama-French factor decomposition, cost-sensitivity
sweeps, and an append-only forward ledger that grades live predictions after the fact so past
calls can't be quietly revised.
The other half of the system points forward. A 106k-parameter multi-modal transformer —
deliberately tiny, because daily market data is small data drowning in noise — reads 60 days
of 13 features and emits three things: the probability of an up-move, a q10–q90 distribution of
the return built so the quantiles can never cross, and a volatility forecast. A Predictor view
blends that price channel with post-earnings drift and news sentiment, weights each by its own
confidence, and lowers the combined confidence when the channels disagree. That is the part
I'd defend: the useful output of a forecaster isn't a number, it's a calibrated distribution and an
honest confidence attached to it.
Reported finding
Run over a 42-variant trend and mean-reversion grid on SPY using Combinatorial Purged
Cross-Validation, the platform reports a 72% probability of backtest overfitting
— the in-sample winner lands in the bottom half out-of-sample more often than not —
and a median of only ~52% of in-sample Sharpe surviving out of sample. An earlier run of the
identical procedure returned 63% and ~38%: same code, same grid, same ticker, different window.
That instability is itself the finding, and the report says so rather than quoting whichever
number flatters the system. The ML forecaster's test
AUC of ≈0.51 on next-week direction is, correctly and publicly, a coin flip. The one clean
positive: a dip-buying strategy on AAPL/MSFT in ranging markets, January 2021 to January 2024,
returning +21.6% against SPY's +5.6%. One more year of data shrinks that edge to +3.6 points,
and the report says so.
Method
The Data-Mining Lab. Generates hundreds of random long/flat strategies that have no edge by construction, keeps the luckiest, and shows the naive statistics calling it significant while the Deflated Sharpe correctly calls it noise. The gap between those two numbers is the argument the whole system is built on.
Architecture. The browser holds all UI state and the backend is a pure compute layer; the ML model is trained offline and shipped as a portable ONNX artifact — ~40 MB of ONNX Runtime instead of PyTorch's 700 MB, which is what lets it serve inside a 512 MB free tier. 15 API endpoints, five of them forward-looking rather than backtest-looking.
Forecast honesty. Calibration scores the model only on data after its validation cutoff — a claim of “60% up” is worthless unless the market rises about 60% of the time it is said. Test AUC comes back at ≈0.51 and the page says so. The forward ledger then logs every live prediction at the moment it is made and grades it once the horizon elapses, append-only, so the hit rate cannot be refitted in hindsight.
What the shipped model can't do. The committed checkpoint was trained with the macro and news blocks zero-filled, so it currently predicts from price alone; the multi-modal plumbing is real and tested, and a retrain activates the other two channels with no code change. The metadata file shows it — those five features carry a standard deviation of exactly zero.
Indicators from first principles. SMA, EMA, RSI, MACD, ADX and Bollinger Bands implemented directly rather than pulled from a TA library, across six strategies plus a no-code custom rule builder and a regime-detecting adaptive mode.
Data resilience. A three-stage cascade — Tiingo, then yfinance, then Stooq — so a single upstream outage doesn't take the system down.
Pipeline. GitHub Actions running 192 pytest cases, flake8 linting and smoke tests on every push.
An engine given the rules of chess and nothing else — no openings, no human games, no
evaluation function — that learns entirely from playing itself. You can play the
trained network in your browser.
TakeawayThe plateau was a training-signal problem, not compute: 10× more self-play moved Elo from −21 to −7; a material signal reached +28.
Screen recording · self-play in the browserThe network playing itself, client-side. Candidate moves and their evaluations appear on
the left as the search runs; the move list and captured material fill in as the game goes. The
same page lets you take White and play the trained network yourself.
Self-play games trained
1,000 ~9.8h on 2×T4
Elo vs. random baseline
−21 → +28
Policy head
4,672 move logits
A dual-headed ResNet reads an 18×8×8 position tensor and emits both a move
policy and a position value in [−1, 1]; PUCT Monte-Carlo tree search balances the
running value estimate against the network's priors; self-play generates the
(position, search policy, outcome) tuples it then trains on. The browser opponent runs the
exported network client-side through ONNX Runtime Web.
Reported finding
Scaling self-play 10× barely moved the needle: 92% of games were still non-decisive and
Elo went from −21 to only −7. Adding a material signal reached +28. The diagnosis in
the writeup is that this is “a self-play signal problem, not a compute ceiling”
— draw-heavy self-play starves the value head of gradient. The classical alpha-beta
engine built as a control beat the random baseline 10–0, confirming the harness itself was sound.
Method
Modular by component so each piece is testable in isolation: chess_game.py (rules and encoding), model.py (network), mcts.py (search), self_play.py / training.py (the learning loop), evaluation.py (strength measurement).
Trained with cross-entropy loss against the MCTS visit distribution and mean-squared error against the final game outcome.
Three ways in: a browser UI, a console client, and a FastAPI HTTP API.
39-test pytest suite on GitHub Actions, including an ONNX-vs-PyTorch parity check on the exported network.
A real-time market dashboard — streaming prices, Federal Reserve data, news sentiment and
an assistant that answers questions about your portfolio rather than the market in general.
TakeawayEvery indicator hand-coded on NumPy and streamed live, with an assistant that reasons about your actual holdings.
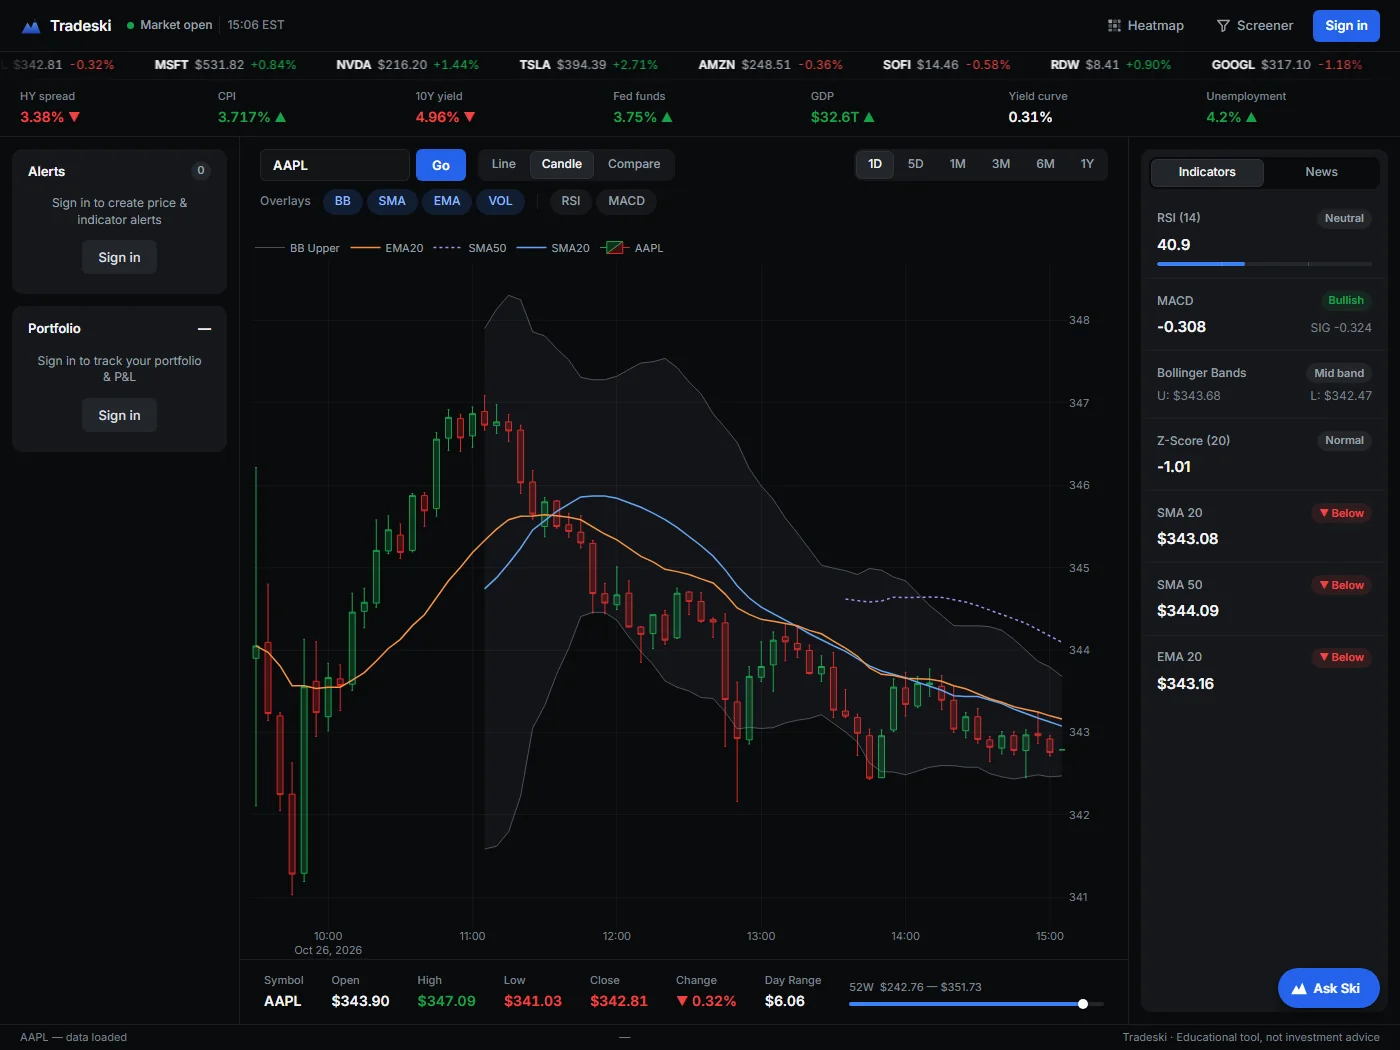
Screenshot · the live dashboardThe terminal in normal operation. Streaming ticker strip, seven FRED macro series,
candlesticks with hand-rolled overlays, and a live indicator panel — every quantitative
figure computed on raw NumPy arrays rather than a TA library.
Scroll it sideways to read the detail.
Symbols tracked live
11 ticker + correlation matrix
Fed series, hourly refresh
7 via FRED API
Tests in CI
112 across 14 files
The engineering interest here is everything around the charts. Every quantitative indicator
— SMA, EMA, RSI with Wilder smoothing, MACD, Bollinger Bands, ATR, stochastic, Z-score,
volatility, linear regression — is hand-coded on raw NumPy arrays: no TA-Lib, no pandas.
A persistent WebSocket backend feeds a fully static frontend, with a caching layer tuned per
data source (prices 5 minutes, news 30, FRED and correlations an hour) and per-route rate
limiting to keep third-party API budgets intact.
Method
Risk metrics. Sharpe ratio, beta against the S&P 500 and annualized volatility computed from a year of daily returns weighted by current market value, plus a 90-day pairwise return-correlation heatmap across all tracked symbols.
Sentiment. VADER extended with roughly 30 finance-specific terms — beats → +2.0, bankruptcy → −3.0 — because general-purpose sentiment models misread earnings language.
Assistant. Grounded in the user's live macro, portfolio and news context before the model is called, so answers are about their actual holdings.
Security. PBKDF2 password hashing, signed bearer tokens, and per-user row scoping isolating portfolios, alerts and watchlists.
Screener. A 29-symbol universe — 27 stocks across five sectors plus SPY and QQQ — fetched concurrently through an 8-worker thread pool.
Screen recording · the app's idle demoThe brush engine, in the app's own idle mode. With no hand in frame the canvas drives
itself, which shows the rendering honestly: one stroke path mirrored into six-fold symmetry,
additive blending, shadow-blur glow and a slow fade. With a webcam, that path is your fingertip.
Hand landmarks tracked
21 per hand, in 3D
Inference rate
~60/s fully on-device
Build step
None one HTML file, no server
Built for Hack the Arts 2026, whose theme was art that wouldn't exist without technology —
so the hand tracking isn't a control scheme bolted onto a paint program, it's the medium.
MediaPipe Tasks Vision locates 21 3D points per hand about sixty times a second entirely in the
browser; a one-euro filter smooths the jitter out of raw landmark data so strokes stay clean;
Canvas 2D renders them with additive blending and shadow-blur glow. Nothing leaves the device.
Method
Gesture vocabulary. Pinch to paint; other hand positions erase, change color and clear the canvas — no UI chrome between the person and the drawing.
Brushes. Neon glow, ribbon, spray, comet and embers, each a different stroke-accumulation model.
Symmetry. Kaleidoscope mirroring at 2, 4, 6 and 8 folds, applied as a transform on the stroke path.
Extras. Full-body pose painting, an attract mode for unattended displays, and save/record output.
Constraint. Pure HTML, CSS and JavaScript in a single file — no framework, no build, no backend. MediaPipe runs via WebAssembly and GPU.